
$17,349,341.74
Total price improvements for equities and options orders in Q1 of 2026¹.
Institutional-grade tools and execution services
Total price improvements for equities and options orders in Q1 of 2026¹.
Average price improvement per order in Q1 of 2026. Covered equity market orders*.
Speed on market orders in Q1 of 2026. Equity market orders*.
At or better % in Q1 of 2026. Equity market orders, all sizes*.
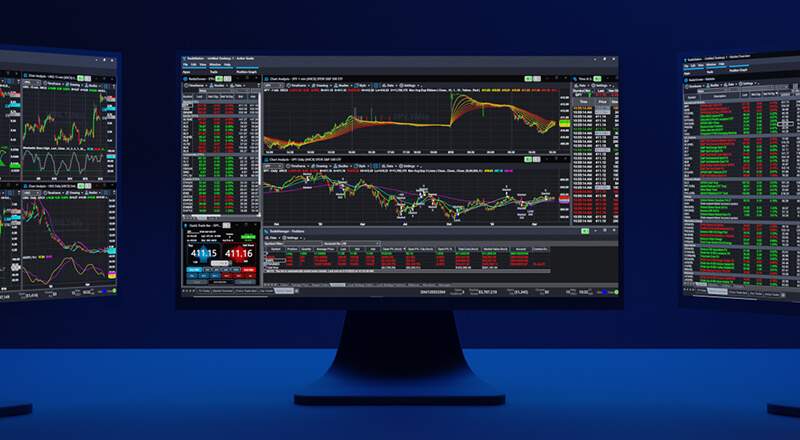
Features include:
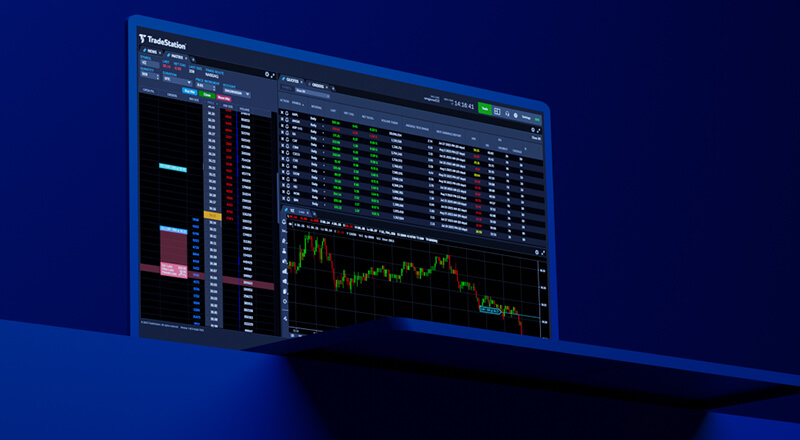
Features include:
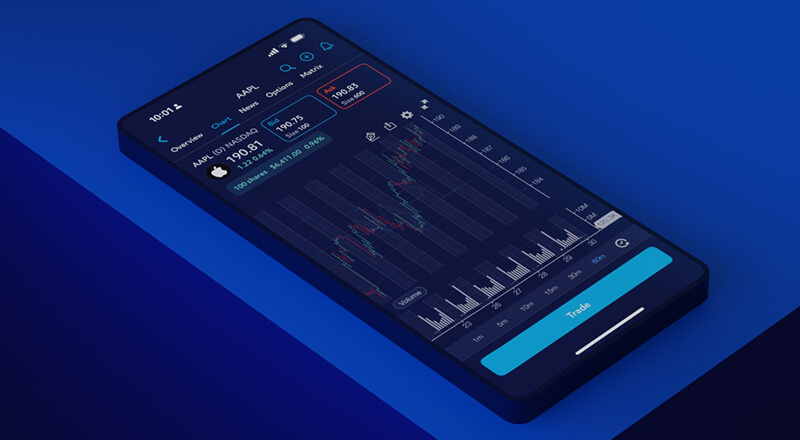
Features include:
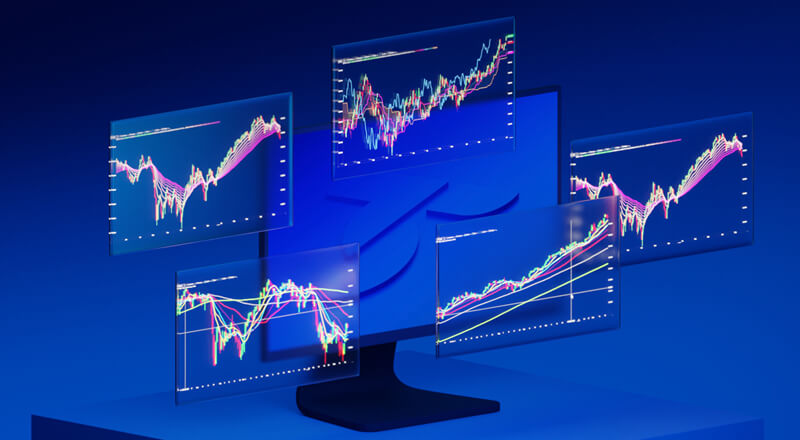
Electronic Trading via FIX or direct API connectivity.
Features include:


Visit https://tradestation.eu/awards/ for details.
¹Statistics provided by S3 Matching Technologies LP, an independent company that is not affiliated with TradeStation Securities Inc. Data shown for Q1 2025 calendar year.
Per-share commission pricing applies to stock trades executed through a Tradestation Securities equities account. Fees and charges may apply. Visit www.TradeStation.com/Pricing to learn more about all the fees and charges that may apply.
Margin trading involves risks, and it is important that you fully understand those risks before trading on margin. The Margin Disclosure Statement outlines many of those risks, including that you can lose more funds than you deposit in your margin account; your brokerage firm can force the sale of securities in your account; your brokerage firm can sell your securities without contacting you; and you are not entitled to an extension of time on a margin call. Review the Margin Disclosure Statement at www.TradeStation.com/DisclosureMargin
ID4522721 D0525
Disclaimer: This link is offered solely for educational and informational purposes and will take you to TradeStation.com, a platform that operates under the supervision of the U.S. Securities and Exchange Commission (SEC).
Please be aware that TradeStation Securities Inc is not regulated by the Dutch Authority for the Financial Markets (AFM) and may provide services that are unavailable to customers residing in Europe.